Visual Consistency Data Improves Writing Endurance
Word count is a vanity metric. Consistency is a professional one. I built the Consistency Graph™ because a visual streak is the most powerful psychological trigger for discipline. It turns the abstract goal of finishing a series into a tangible, daily win.— Ben Wilson, Founder & Author
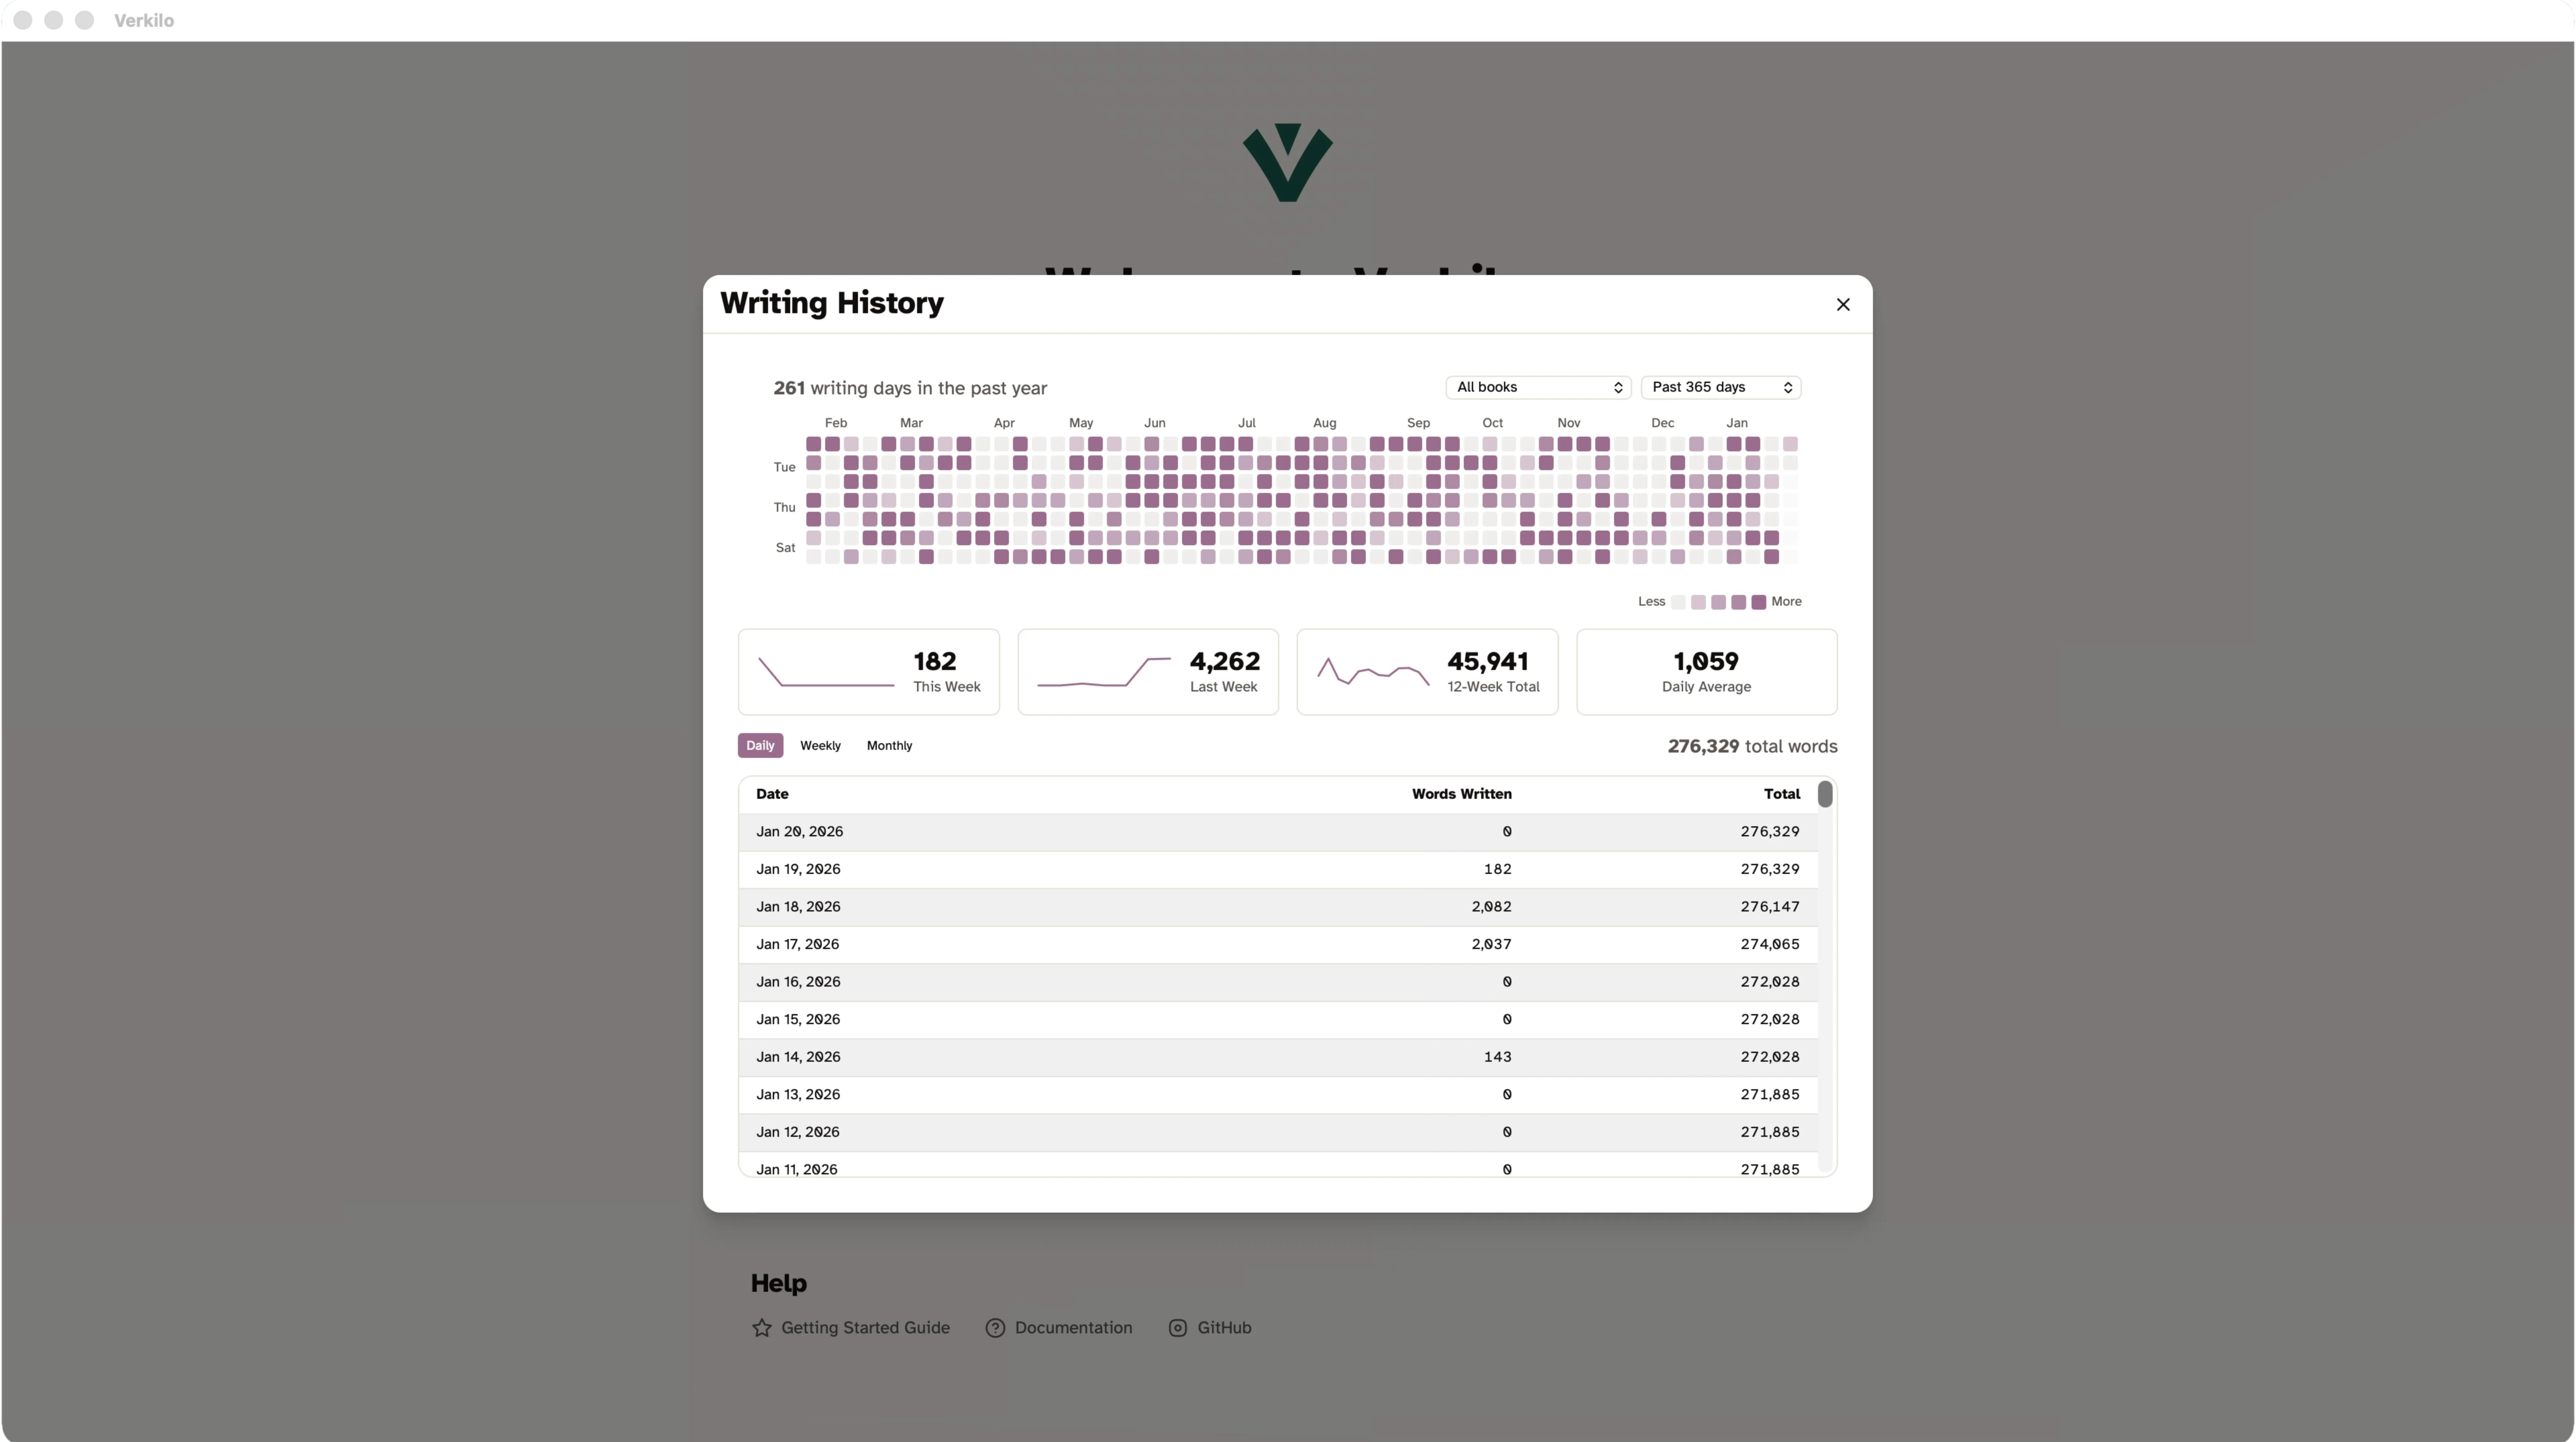
The Consistency Graph™
Verkilo maps your creative output over a rolling 365-day window. The heatmap visualization transforms raw data into a picture of your dedication, showing you when your velocity is highest and helping you protect those productive periods.
- 365-day writing calendar. A visual record of daily volume. Darker cells highlight your most productive days, helping you identify patterns and schedule around your natural rhythms.
- Multi-book filtering. Drill down into specific manuscripts or view your entire saga's momentum. See how your effort is distributed across Book 1, Book 2, and your Series Bible.
- Key metrics at a glance. Track your average daily words, total project volume, and current streak through simple data cards.
Your Productivity Data Stays Private
Your writing habits are nobody's business but yours. Verkilo's analytics are generated and stored entirely within your local project database. No third party tracks, analyzes, or monetizes your creative patterns.
- All data stays local. Word counts and streak metrics never leave your machine. Your productivity dips and creative velocity remain private.
- Projected completion dates. Use your historical output to project realistic
ready for editor
dates. Plan publication launches based on verified writing history, not wishful thinking. - Works offline. Your analytics engine requires zero internet connectivity. Whether you're writing in a cabin or a cafe, your progress is recorded instantly.
Small Daily Wins Compound Into Finished Books
Jerry Seinfeld famously described his writing method: put a red X on the calendar every day you write, then don't break the chain. The same psychology applies here. Each small session adds a mark to your graph, and the accumulating visual record creates its own momentum.
- The chain effect. Seeing an unbroken streak makes you want to protect it. This helps you push through the difficult middle sections of a manuscript.
- Realistic goal setting. Set daily targets based on your actual 90-day averages, not arbitrary round numbers. This reduces burnout and increases your odds of finishing.
- Series-wide oversight. Maintain visibility across your entire creative output, from the first word of your debut to the final page of your twentieth volume.
Analytics Comparison
| Feature | Standard Word Processors | Verkilo |
|---|---|---|
| Data Privacy | Cloud-tracked, analyzed | Entirely local |
| Visual Habit Map | None (static count only) | 365-day Consistency Graph™ |
| Multi-Book Filtering | Manual calculation | Built into workspace |
| Completion Projection | Guesswork | Based on historical velocity |
Try Writing Analytics & Productivity Tracking Today
Experience the full power of Verkilo with a 14-day free trial.
Start Your Free Trial